You're reading an old version of this documentation. If you want up-to-date information, please have a look at v0.8.2.
Grid Convergence Study (Windows)
Summary
This is a grid convergence study of 5 cases. The case with the finest grid resolution, of 0.0625m, achieved an asymptotic ratio of 1.032 (asymptotic range is indicated by a value \(\approx 1\)). At zero grid resolution, the normalised velocity deficit measured 1.2 diameters downstream from the turbine was 35.85%, a 28.18% error against the measured value of 49.92%. For the centreline velocity transect, the root mean square error at the lowest grid resolution was 0.1954. For the axial velocity at \(x^*=5\) transect, the root mean square error at the lowest grid resolution was 0.1167.
Grid Convergence Studies
Free Stream Velocity
This section presents the convergence study for the free stream velocity (\(U_\infty\)). For the final case, with grid resolution of 0.0625m, an asymptotic ratio of 0.9994 was achieved (asymptotic range is indicated by a value \(\approx 1\)). The free stream velocity at zero grid resolution is 0.8053m/s. The grid resolution required for a fine-grid GCI of 1.0% is 0.2808m.
resolution (m) |
# cells |
\(U_\infty\) |
error |
|---|---|---|---|
1 |
144 |
0.757747 |
0.0591016 |
0.5 |
1152 |
0.783403 |
0.0272444 |
0.25 |
9216 |
0.80086 |
0.00556725 |
0.125 |
73728 |
0.804829 |
0.000638789 |
0.0625 |
589824 |
0.805285 |
7.32951e-05 |
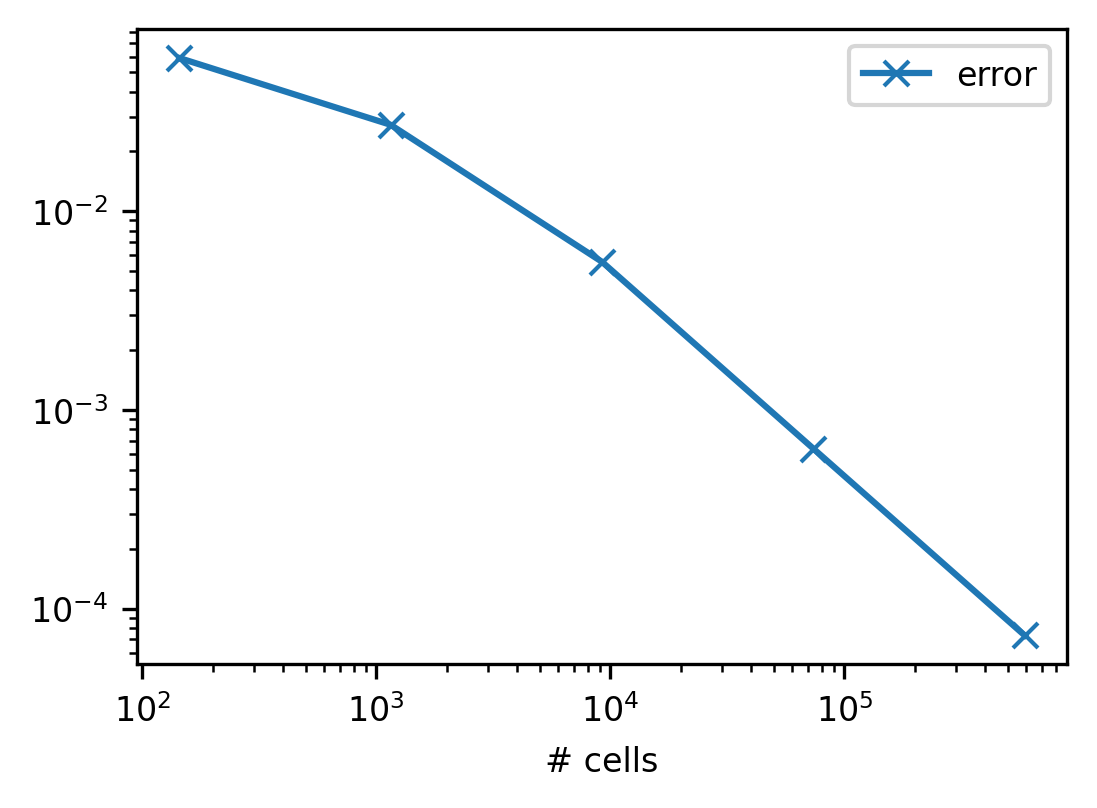
Free stream velocity error against value at zero grid resolution per grid resolution
Wake Velocity
This section presents the convergence study for the wake centerline velocity measured 1.2 diameters downstream from the turbine (\(U_{1.2D}\)). For the final case, with grid resolution of 0.0625m, an asymptotic ratio of 1.032 was achieved (asymptotic range is indicated by a value \(\approx 1\)). The free stream velocity at zero grid resolution is 0.5166m/s. The grid resolution required for a fine-grid GCI of 1.0% is 0.03873m.
resolution (m) |
# cells |
\(U_{1.2D}\) |
error |
|---|---|---|---|
1 |
144 |
0.74141 |
0.435113 |
0.5 |
1152 |
0.678241 |
0.312841 |
0.25 |
9216 |
0.591398 |
0.144743 |
0.125 |
73728 |
0.542273 |
0.0496528 |
0.0625 |
589824 |
0.525421 |
0.017033 |
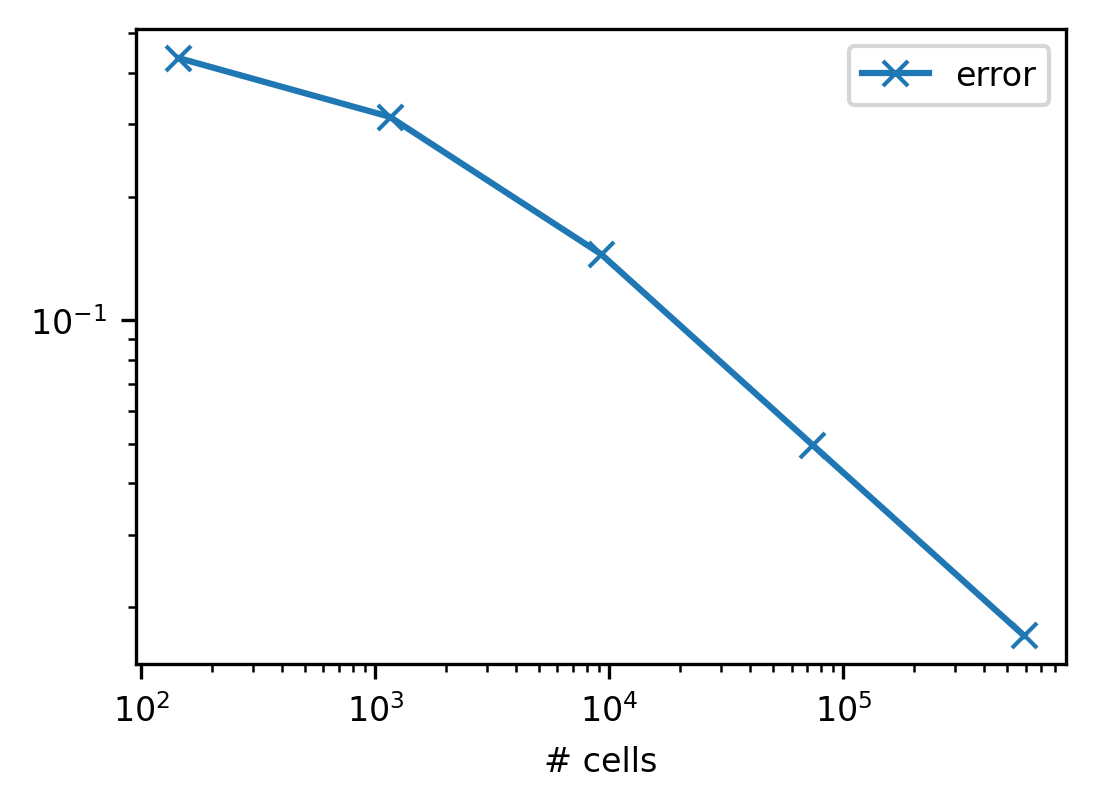
Wake velocity error against value at zero grid resolution per grid resolution
Validation
At zero grid resolution, the normalised deficit of \(U_{1.2D}\), (\(\gamma_{0(1.2D)}\)) is 35.85%, a 28.18% error against the measured value of 49.92%.
Wake Transects
This section presents axial velocity transects along the turbine centreline and at cross-sections along the \(y\)-axis. Errors are reported relative to the experimental data given in (Mycek et al. 2014).
Centreline velocity
The root mean square error (RMSE) for this transect at the finest grid resolution of 0.0625m was 0.1954.
resolution (m) |
RMSE |
|---|---|
1 |
0.419804 |
0.5 |
0.335561 |
0.25 |
0.26347 |
0.125 |
0.22455 |
0.0625 |
0.195446 |
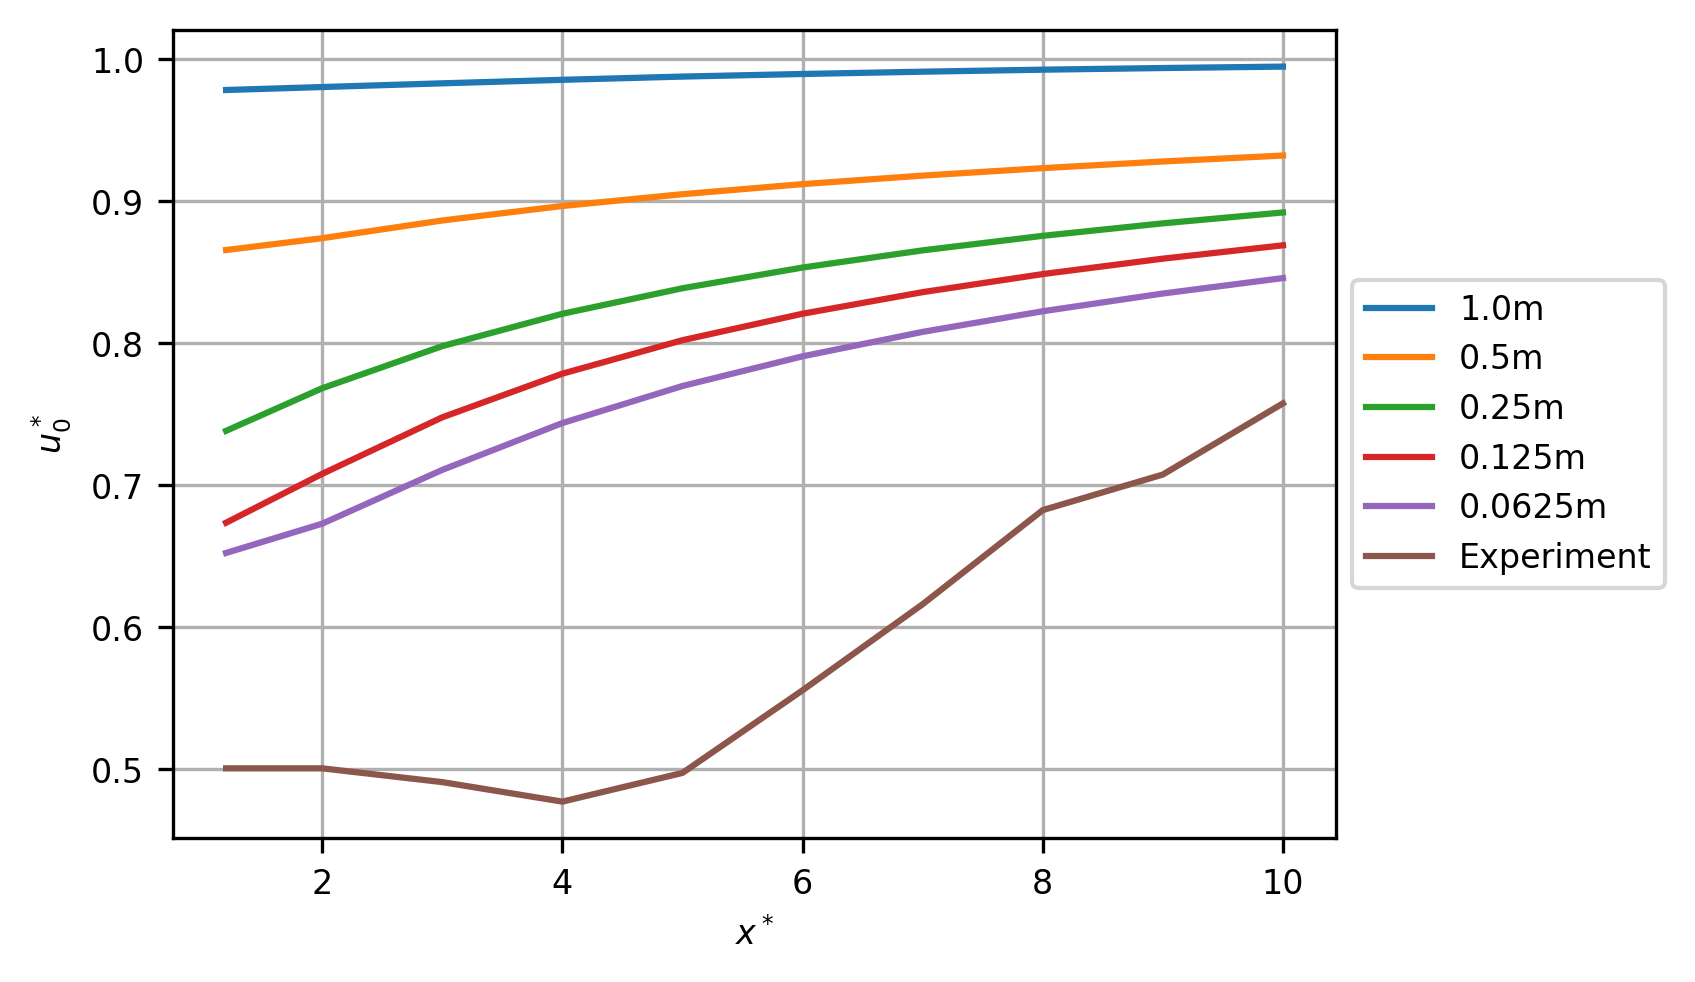
Normalised velocity, \(u^*_0\), (m/s) per grid resolution comparison. Experimental data reverse engineered from (Mycek et al. 2014, fig. 11a).
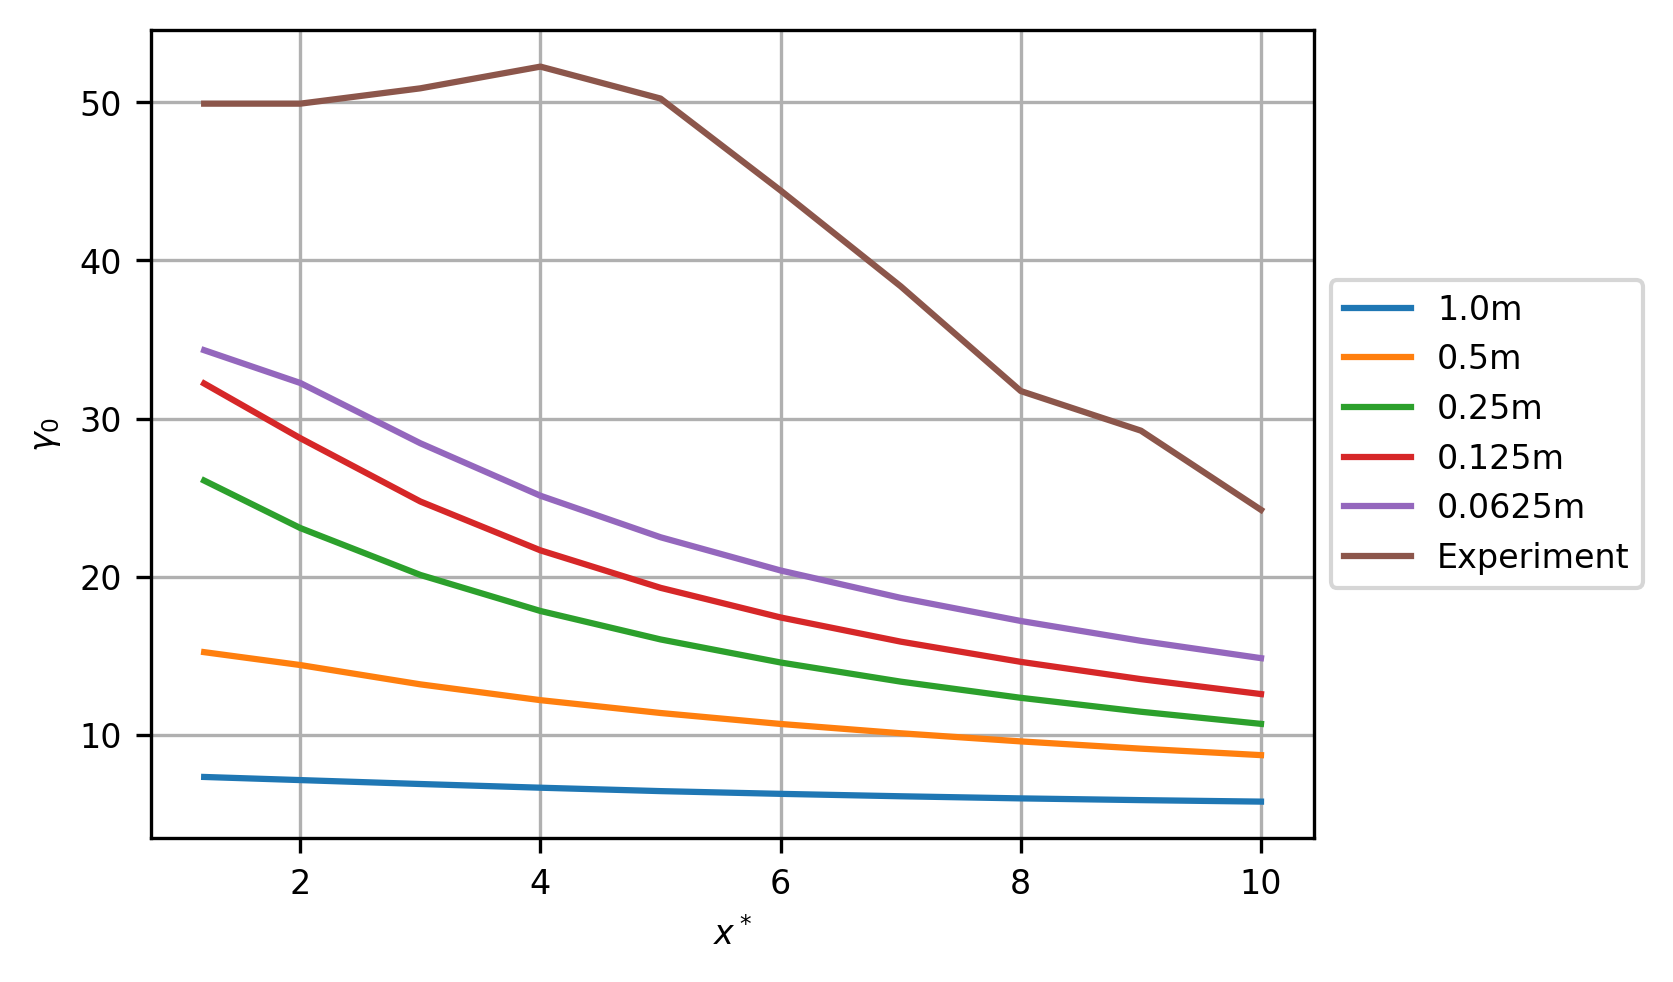
Normalised velocity deficit, \(\gamma_0\), (%) per grid resolution comparison. Experimental data reverse engineered from (Mycek et al. 2014, fig. 11a).
Axial velocity at \(x^*=5\)
The root mean square error (RMSE) for this transect at the finest grid resolution of 0.0625m was 0.1167.
resolution (m) |
RMSE |
|---|---|
1 |
0.213179 |
0.5 |
0.174207 |
0.25 |
0.144064 |
0.125 |
0.128447 |
0.0625 |
0.116704 |
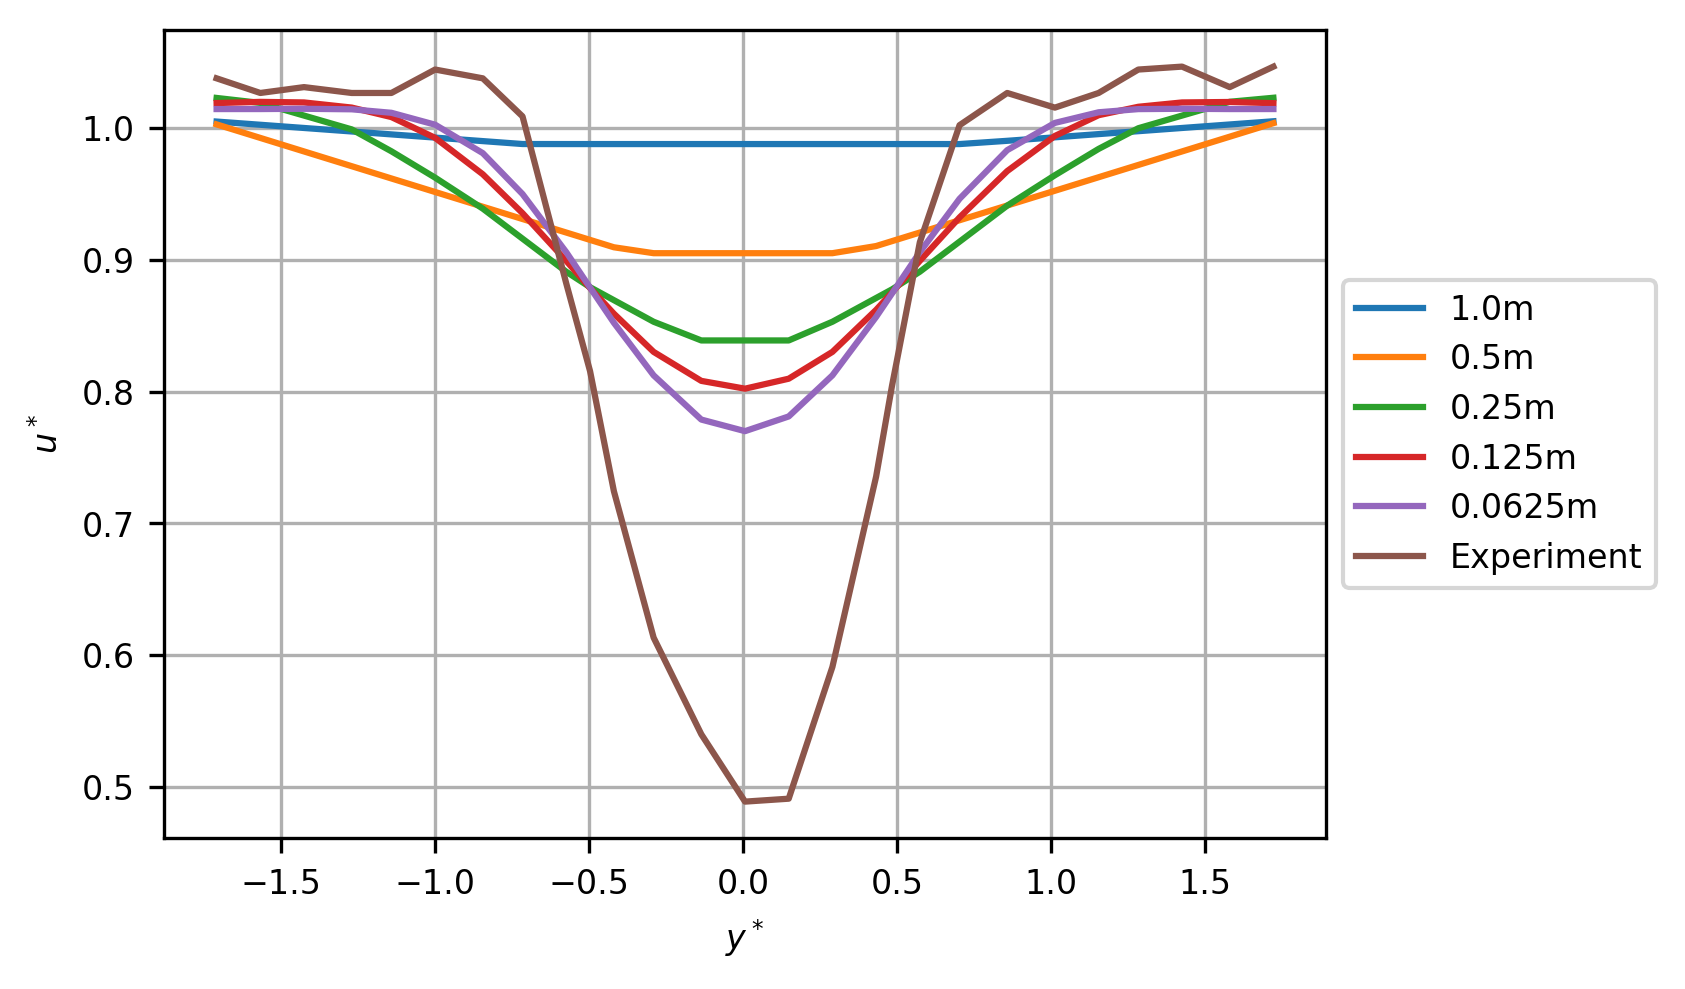
Normalised velocity, \(u^*_0\), (m/s) per grid resolution comparison. Experimental data reverse engineered from (Mycek et al. 2014, fig. A12a).
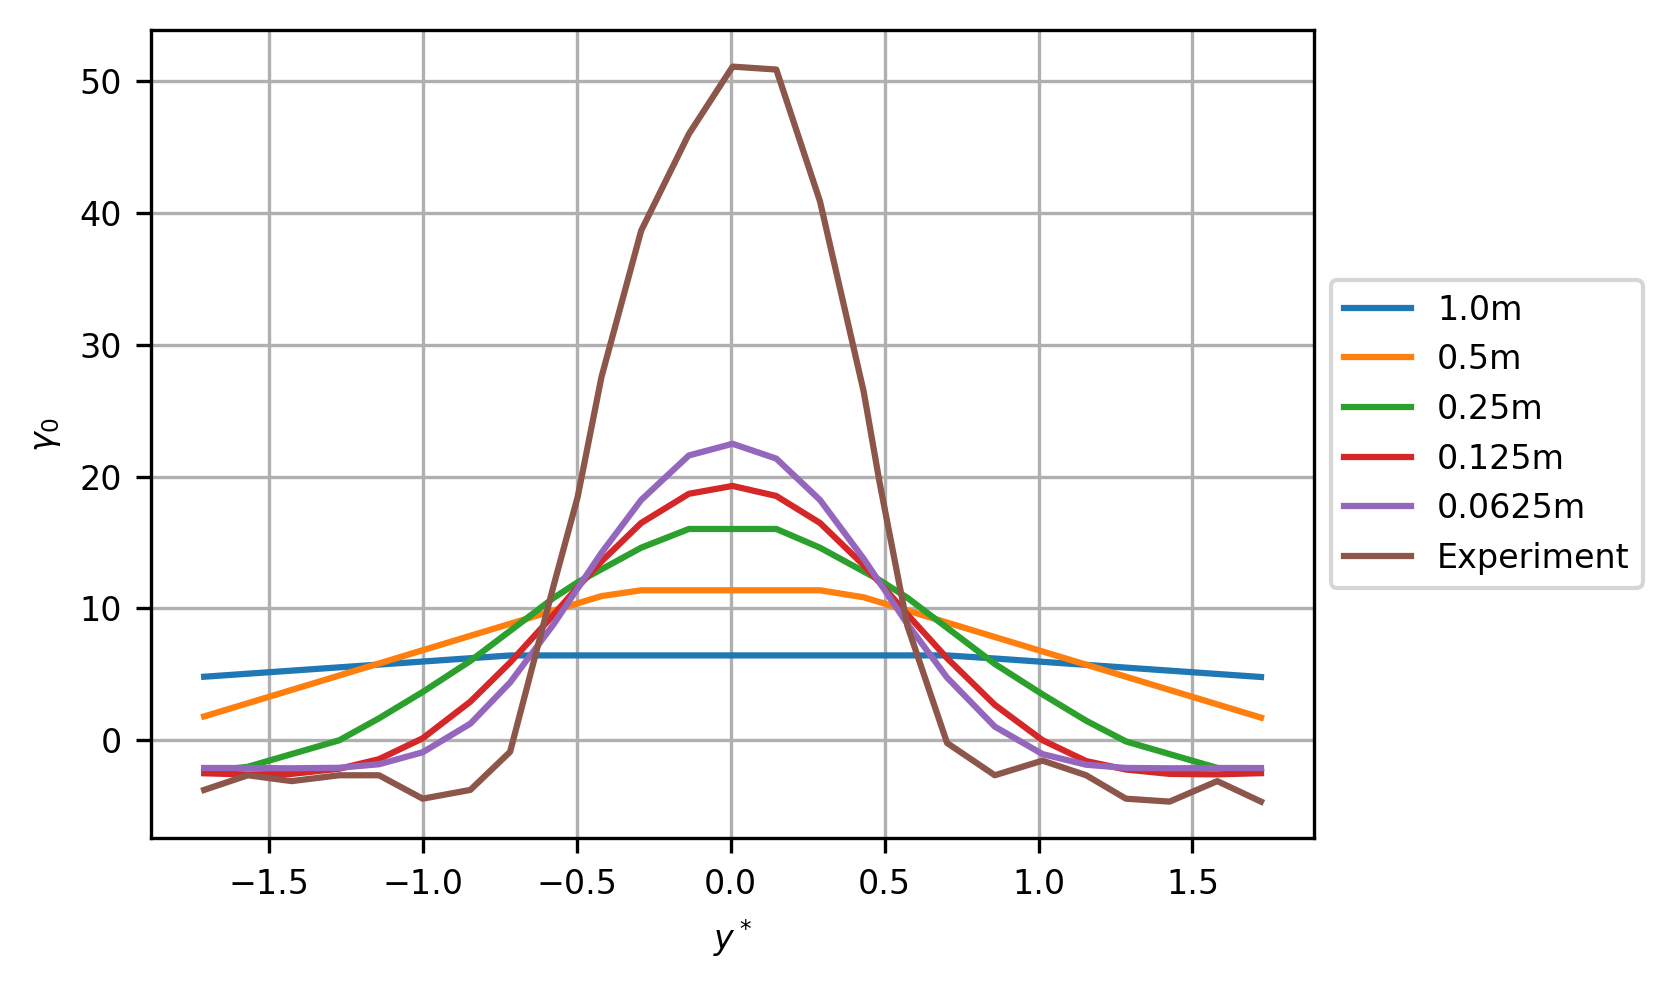
Normalised velocity deficit, \(\gamma_0\), (%) per grid resolution comparison. Experimental data reverse engineered from (Mycek et al. 2014, fig. A12a).
References
Mycek, Paul, Benoît Gaurier, Grégory Germain, Grégory Pinon, and Elie Rivoalen. 2014. “Experimental Study of the Turbulence Intensity Effects on Marine Current Turbines Behaviour. Part I: One Single Turbine.” Renewable Energy 66: 729–46. https://doi.org/10.1016/j.renene.2013.12.036.