Model Comparison (Windows)
Introduction
This is a comparison of the performance of simulations of the Mycek flume experiment (Mycek et al. 2014) using the flexible mesh (FM) and structured grid solvers for Delft3D. The simulation settings are mirrored between the two methods as much as possible. The chosen grid resolution for this study is 0.0625m. Axial and radial velocities and turbulence intensity (TI) in the horizontal plane intersecting the turbine hub will be examined.
Axial Velocity Comparison
This section compares axial velocities between the FM and structured grid models. Figs. 1, 2 show the axial velocity over the horizontal plane intersecting the turbine hub for the FM and structured gird models, respectively. The units are non-dimensionalised by the free-stream velocity, measured at the hub location without the presence of the turbine. If \(u\) is the dimensional velocity, and \(u_\infty\) is the dimensional free stream velocity, then the normalized velocity \(u^* = u / u_\infty\). Note the observable difference in the wake velocities immediately downstream of the turbine between the two simulations.
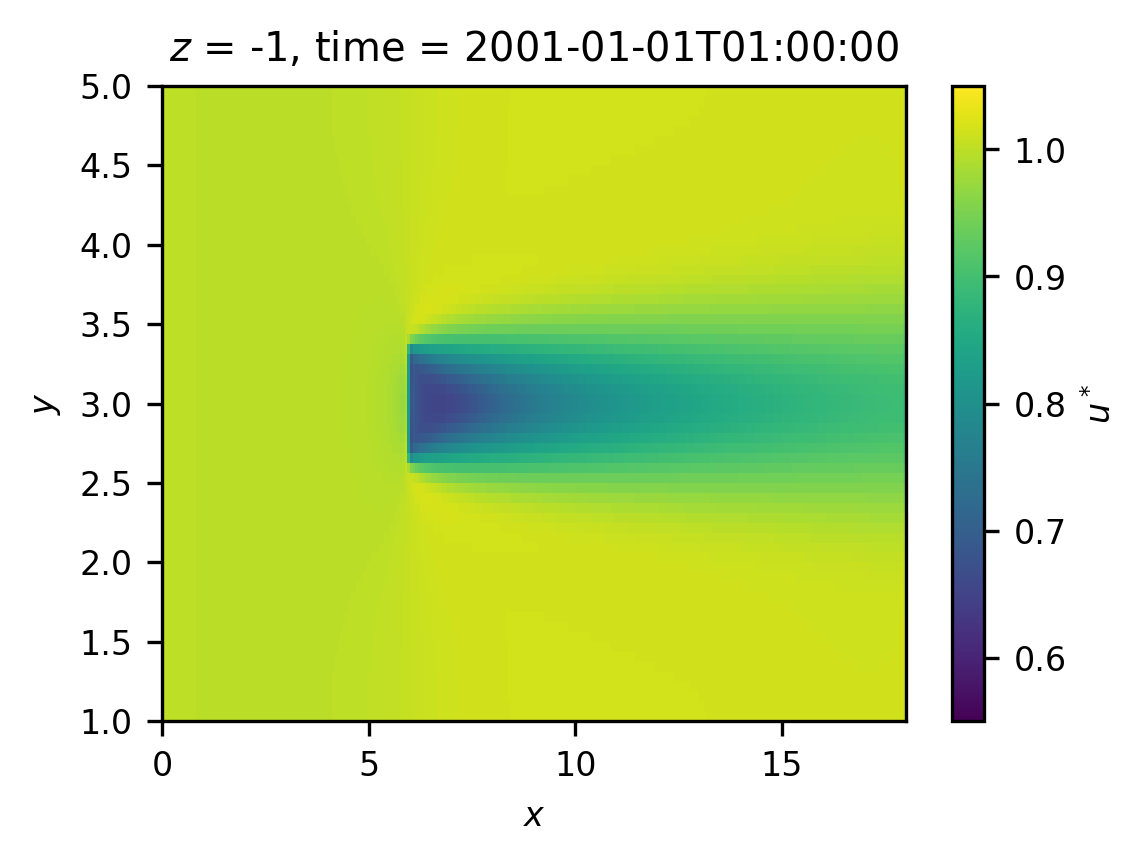
Figure 1: Axial velocity normalised by the free stream velocity for the fm model type
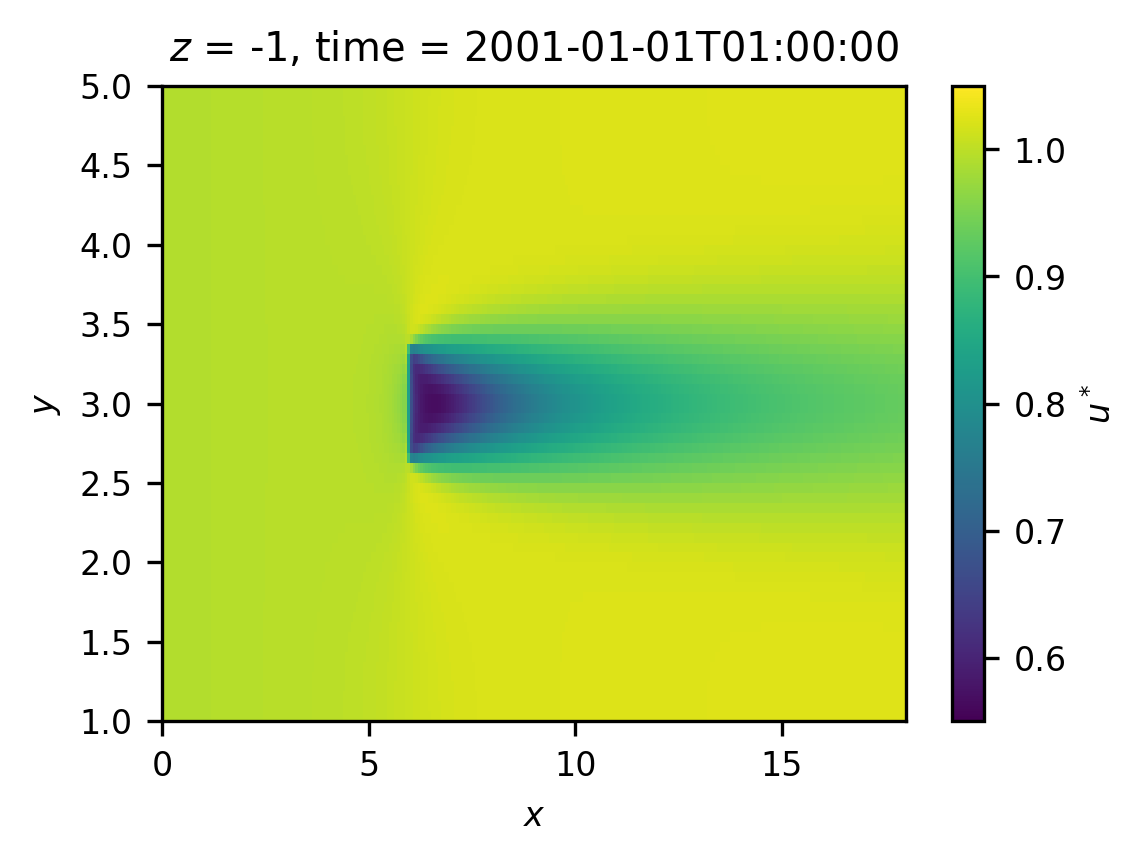
Figure 2: Axial velocity normalised by the free stream velocity for the structured model type
Fig. 3 shows the error between the non-dimensional axial velocities of the structured grid and FM models, relative to the maximum value within the two simulations. Three main areas of difference are revealed, the increased deficit in the near wake for the structured model, the reduced deficit of the structured model in the far wake and the increased acceleration around the edges of the turbine of the structured model.
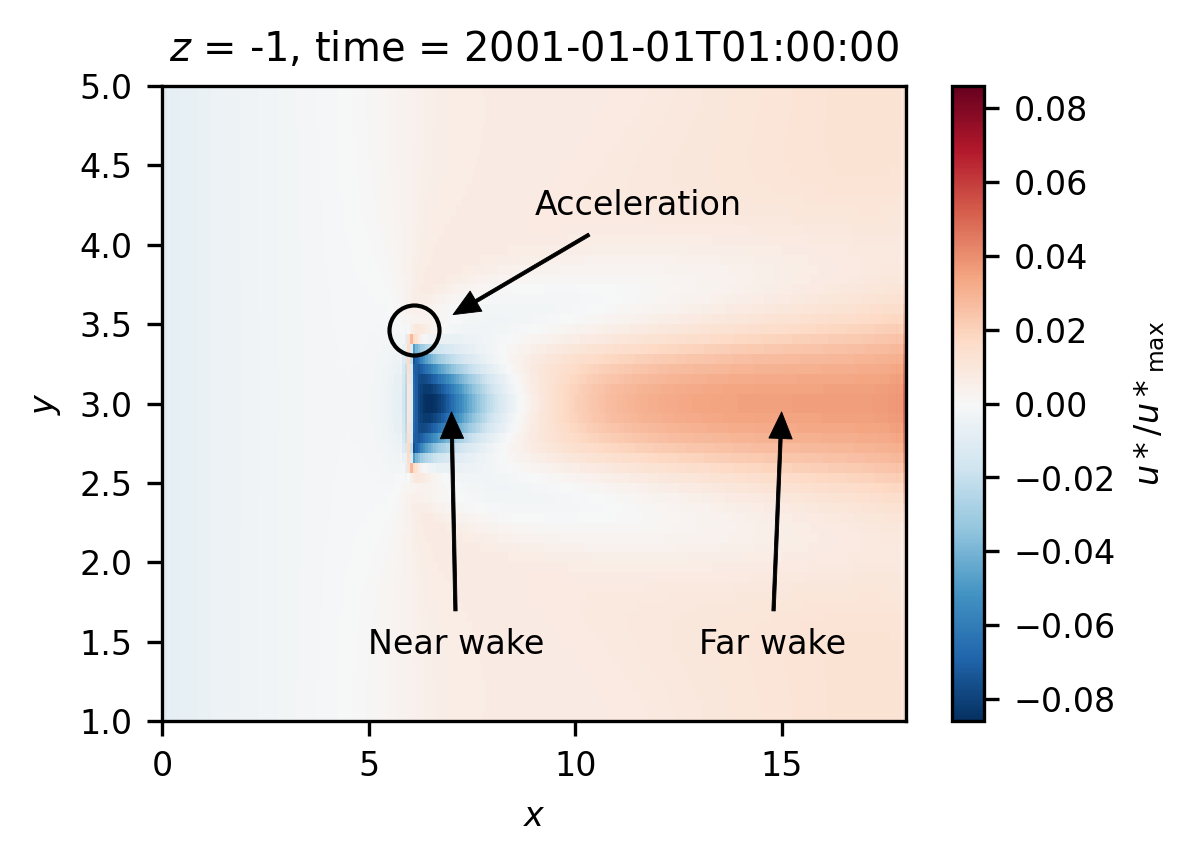
Figure 3: Relative error in normalised axial velocity between the structured and fm models
Comparing the non-dimensional centerline velocities alongside the experimental data (published in (Mycek et al. 2014)) for two turbulence intensity (TI) levels, in fig. 4, confirms the behavior in the near and far wake shown in fig. 3. Generally, the structured model performs better in the near wake compared to the experimental data. In the far wake, the FM model better repesents the 3% TI experimental data, and the structured model matches better to the 15% TI experimental data. Nonetheless, neither model captures the experimental measurements well for the whole centerline. Note that the TI within the Delft3D simulations is between 5% and 6%.
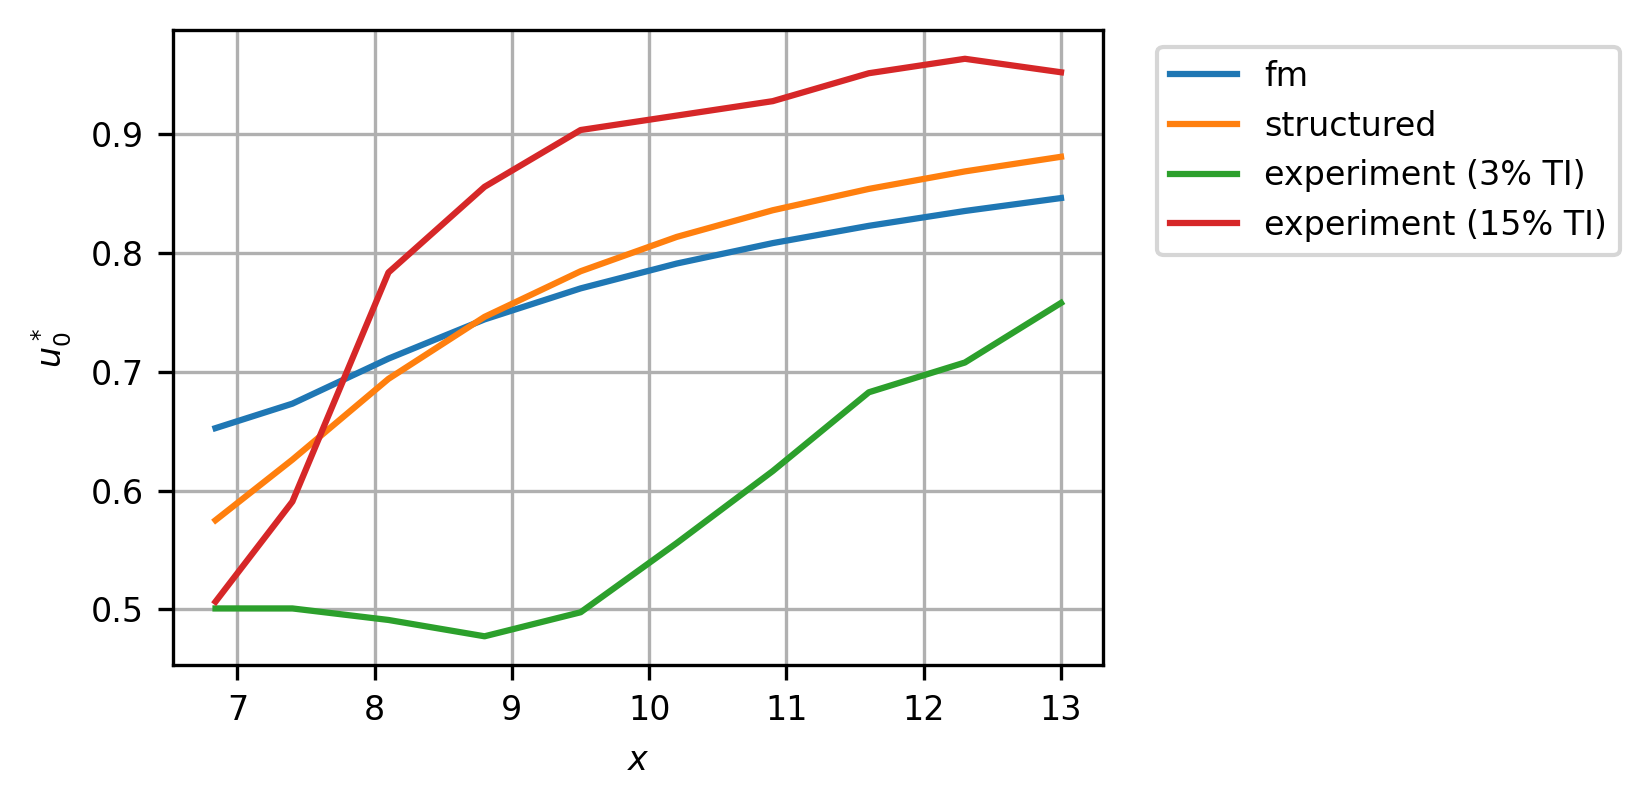
Figure 4: Comparison of the normalised turbine centerline velocity. Experimental data reverse engineered from (Mycek et al. 2014, fig. 11a & 11b).
Radial Velocity Comparison
This section compares radial velocities between the FM and structured grid models. Figs. 5, 6 show the radial velocity over the horizontal plane intersecting the turbine hub for the FM and structured gird models, respectively. The units are non-dimensionalized by the free-stream velocity, (in the axial direction) measured at the hub location without the presence of the turbine. If \(v\) is the dimensional velocity, then the normalized velocity \(v^* = v / u_\infty\). Note the increased radial velocities recorded for the structured grid compared to the FM simulation.
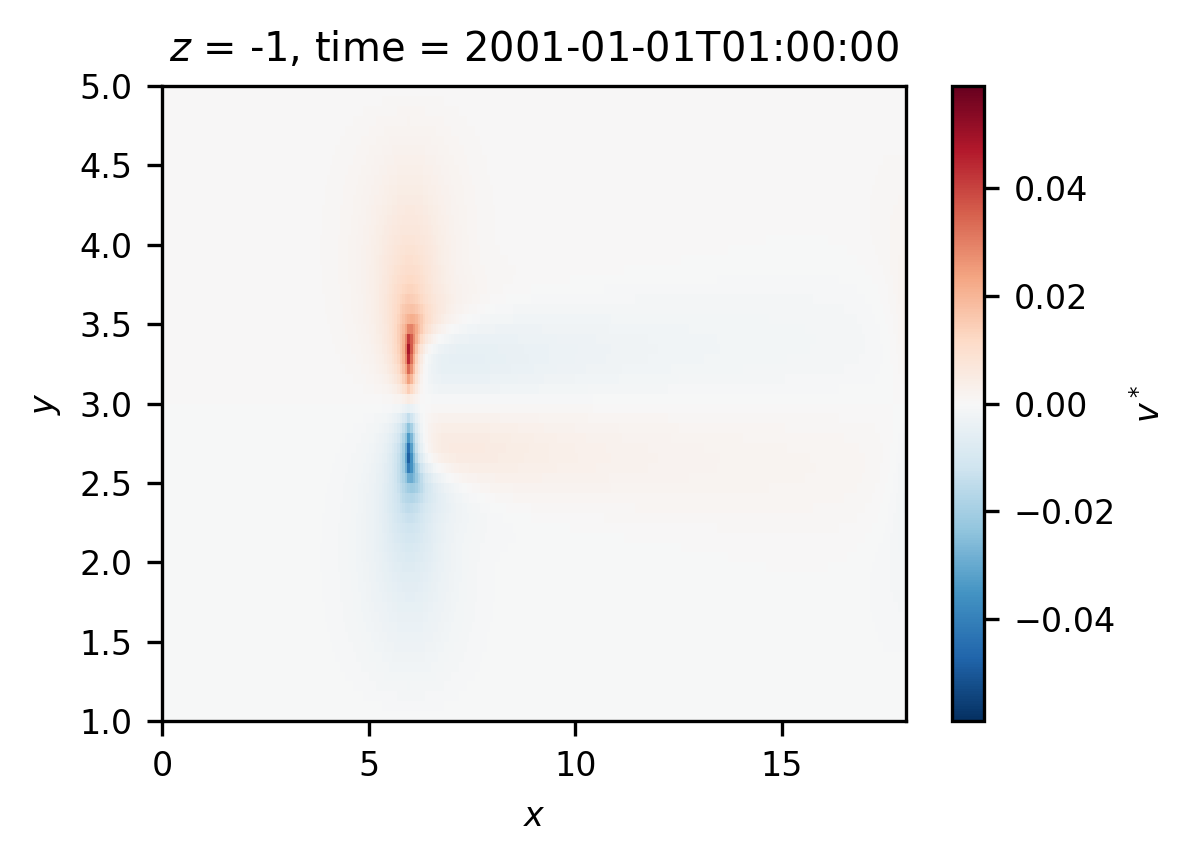
Figure 5: Radial velocity normalised by the free stream velocity for the fm model type
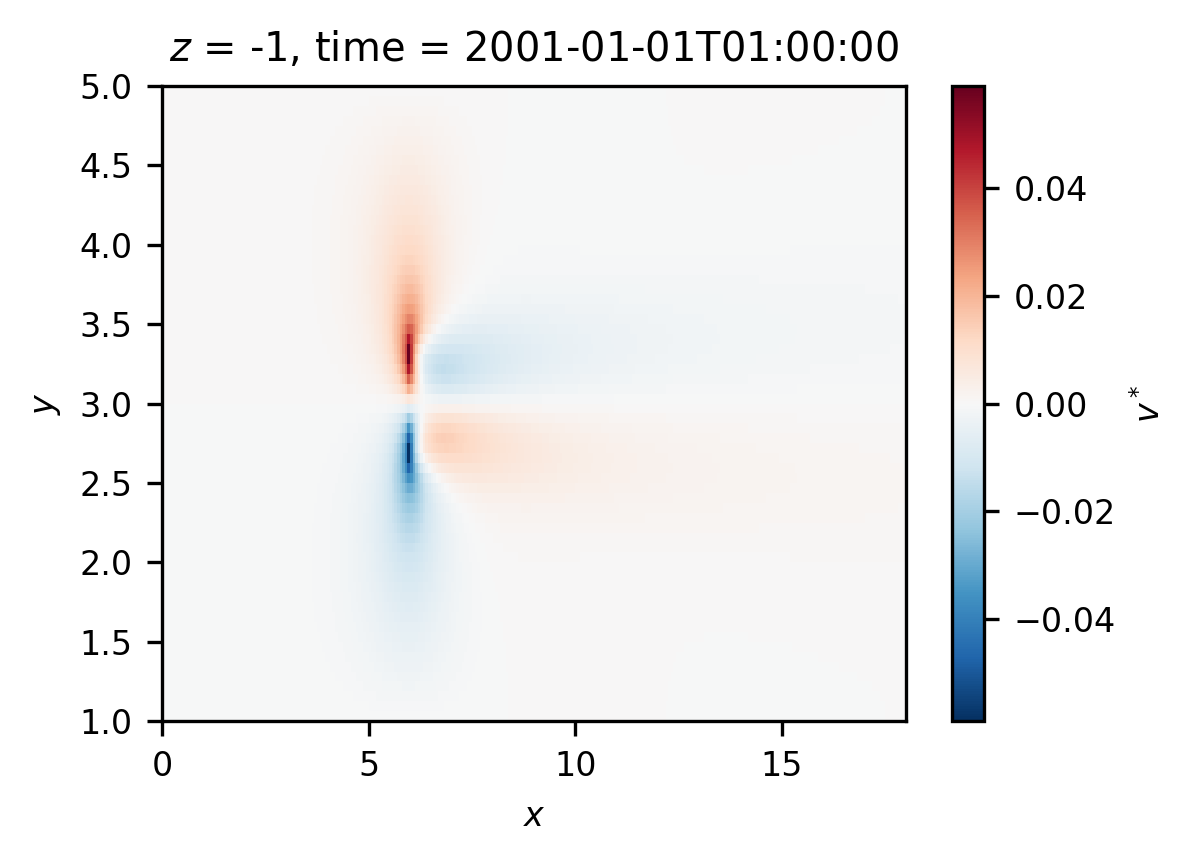
Figure 6: Radial velocity normalised by the free stream velocity for the structured model type
Fig. 7 shows the error between the non-dimensional radial velocities of the structured grid and FM models, relative to the maximum value within the two simulations. The largest errors are seen upstream of the turbine, while smaller errors are seen downstream of the turbine. The errors in the radial flow are also much higher than for the axial flow, with the maximum error in radial velocity being 0.2425, while the error is 0.08593 for the axial velocity (from fig. 3).
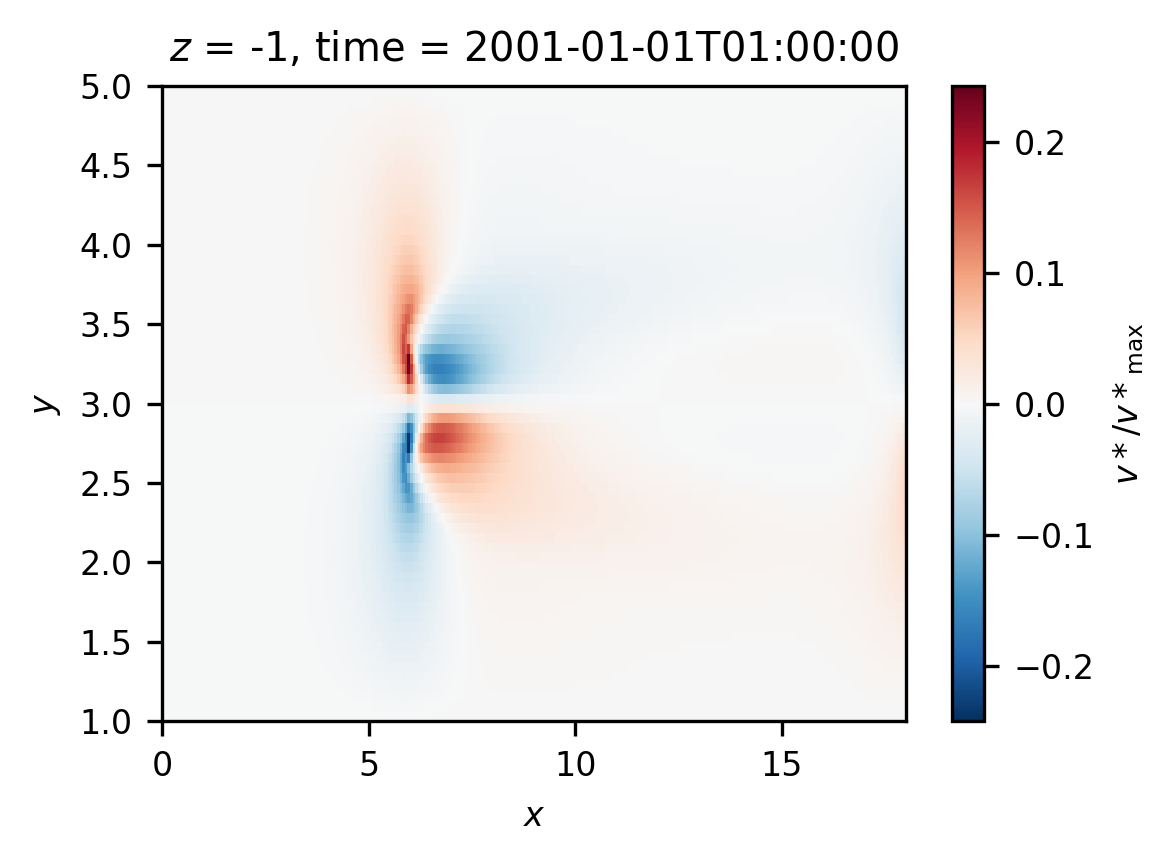
Figure 7: Relative error in normalised radial velocity between the structured and fm models
Turbulence Intensity Comparison
This section compares turbulence intensity (TI) values between the FM and structured grid models. Figs. 8, 9 show the normalized TI over the horizontal plane intersecting the turbine hub for the FM and structured gird models, respectively. The units are non-dimensionalized by the free-stream TI measured at the hub location without the presence of the turbine. For the structured grid simulation the free stream TI is 5.273 % and for the FM simulation it is 5.281 %. If \(I\) is the dimensional TI, then the normalized TI \(I^* = I / I_\infty\). Note the increased levels of TI over wider radial distances from the wake centreline for the FM model, while the increased TI is concentrated directly downstream of the turbine for the structured grid simulation. This differing behaviour is confirmed when differencing the two simulations, as shown in fig. 10.
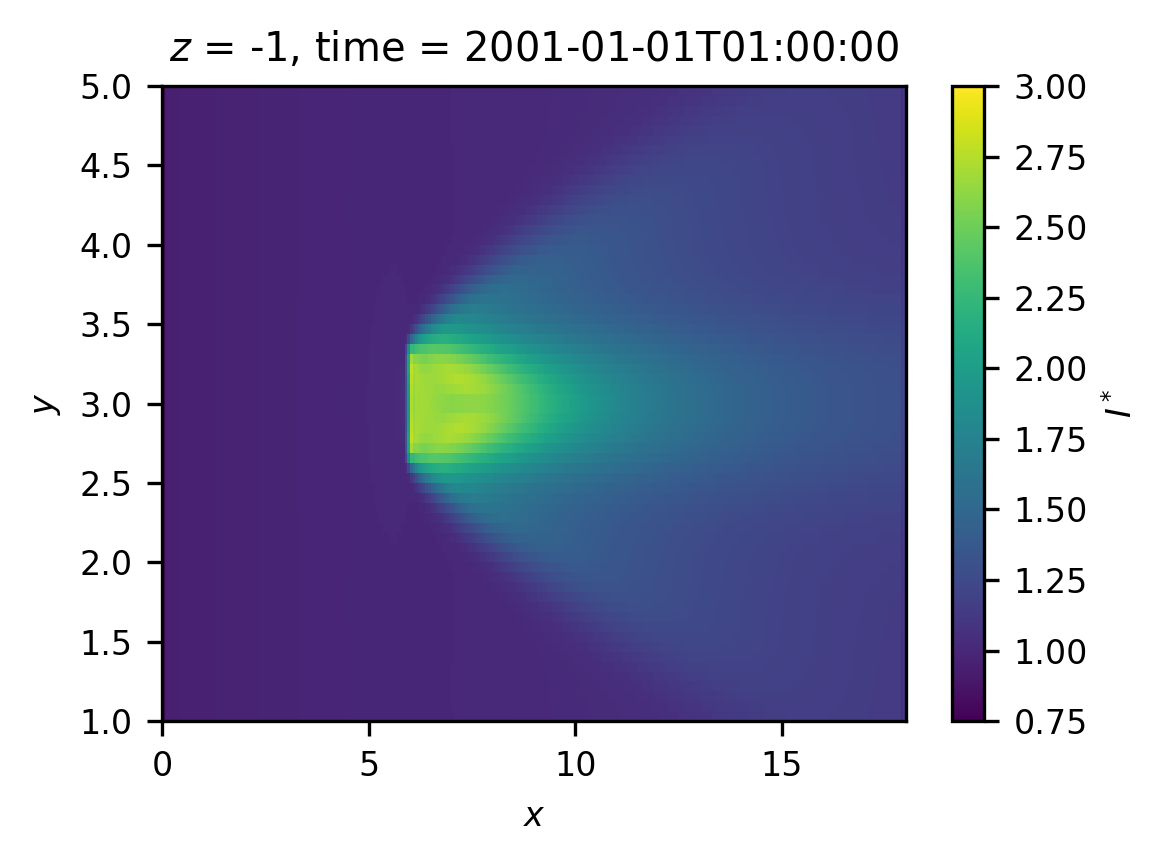
Figure 8: Turbulence intensity normalised by the free-stream value measured at the turbine hub, \(I^*\), for the fm model type
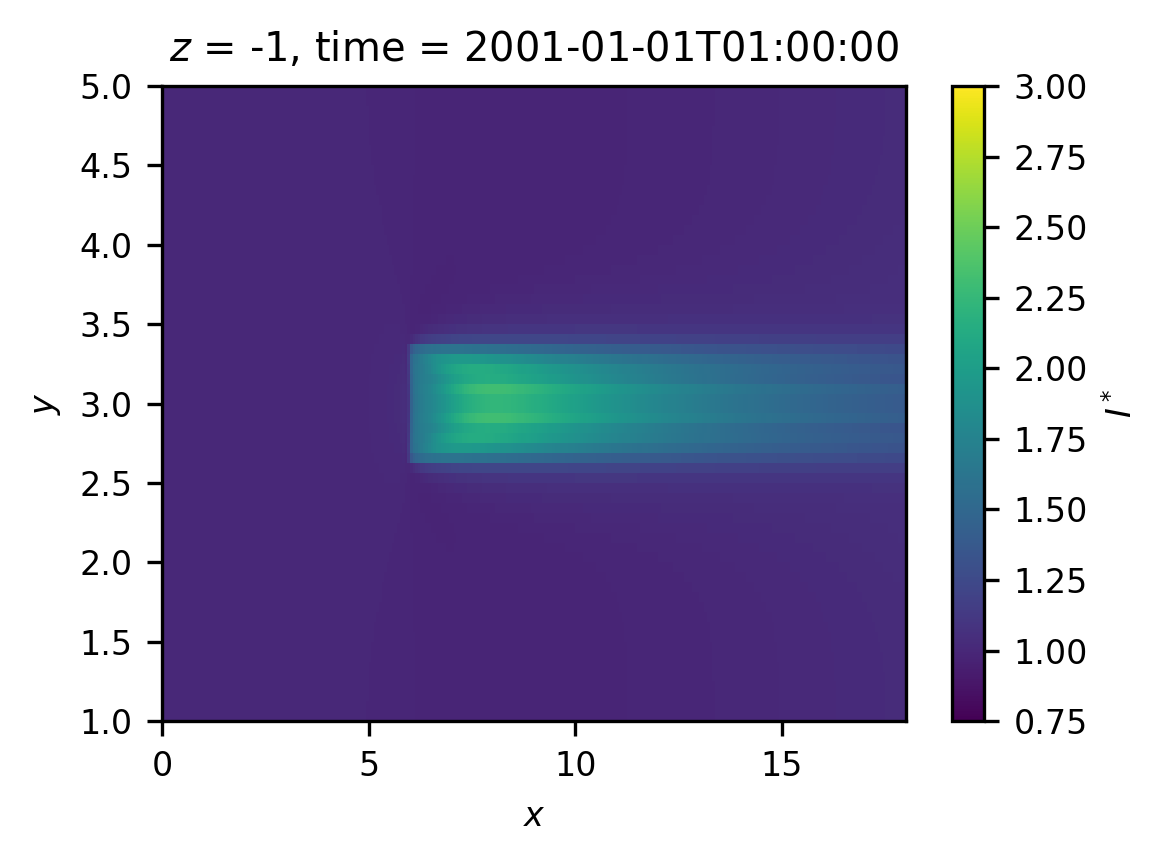
Figure 9: Turbulence intensity normalised by the free-stream value measured at the turbine hub, \(I^*\), for the structured model type
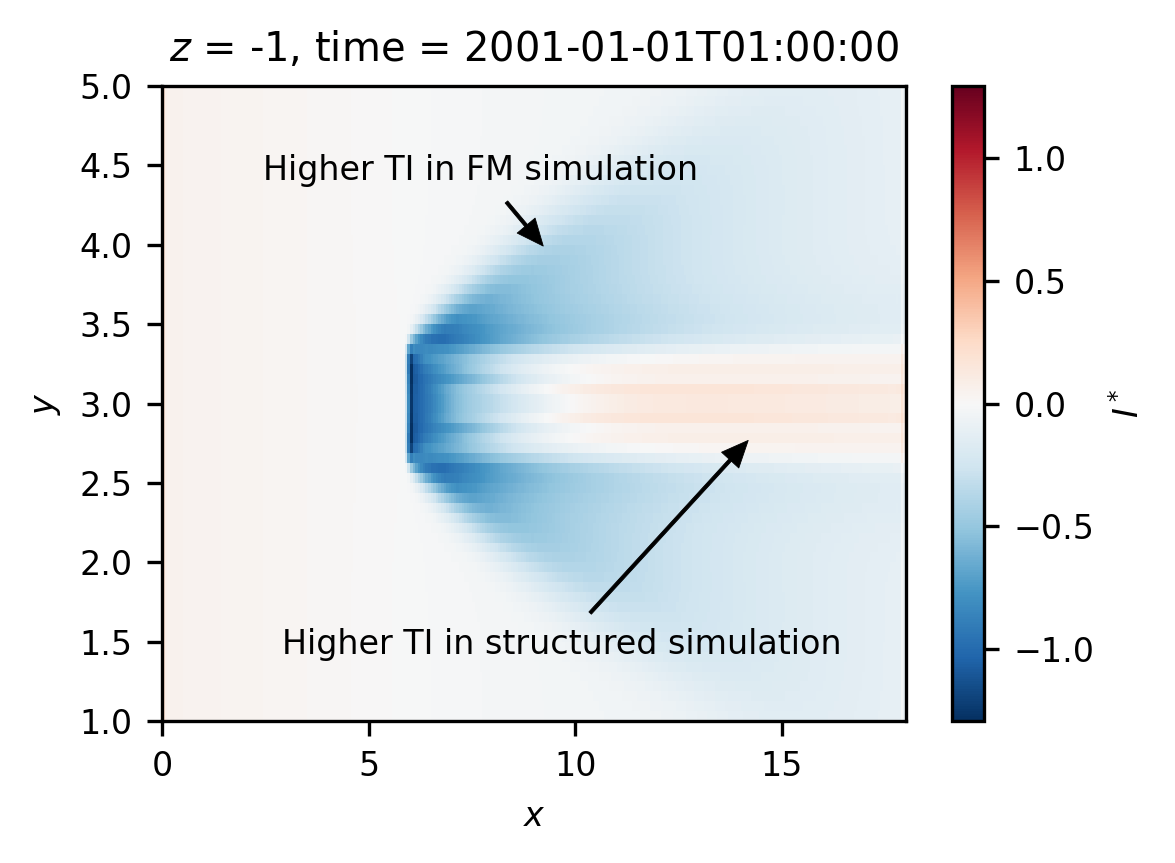
Figure 10: Difference in normalised TI between the structured and FM simulations
The non-dimensional TI values along the wake centerline are compared with the experimental data (published in (Mycek et al. 2014)) for two turbulence intensity (TI) levels in fig. 11. Both the structured and FM models more closely represent the results from the 15% TI experimental data, although both simulations fail to capture the mixing behaviour in the far wake. Neither simulation resembles the very large increases in normalized TI seen in the 3% TI experimental data.
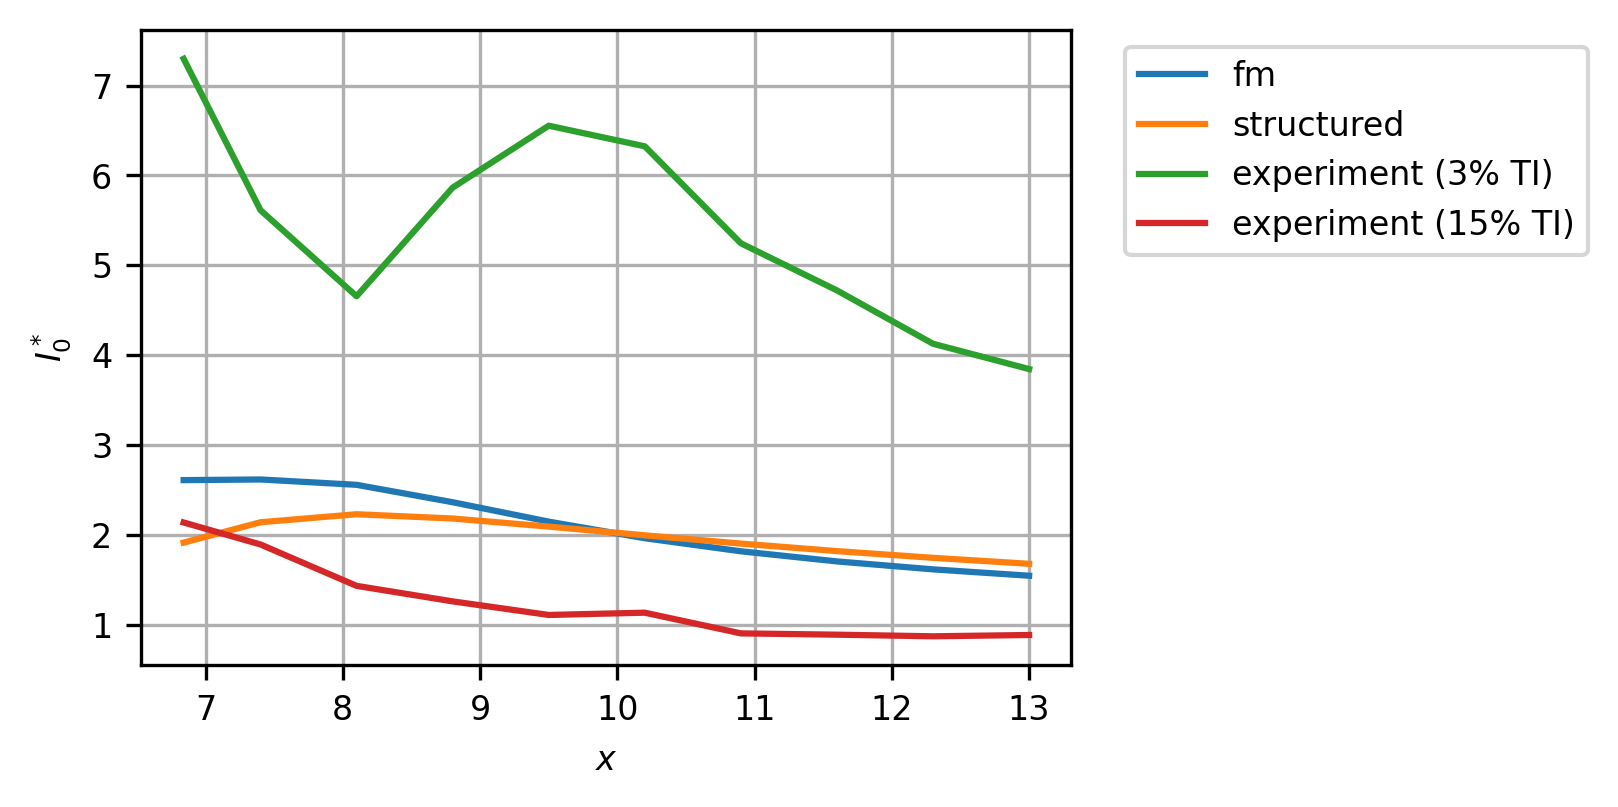
Figure 11: Comparison of the normalised turbine centerline tubulence intensity. Experimental data reverse engineered from (Mycek et al. 2014, fig. 11c & 11d).
Conclusion
Comparison of simulations of the 2014 Mycek flume experiment (Mycek et al. 2014) using the flexible mesh (FM) and structured grid solvers for Delft3D, reveals significant differences. As seen in sec. 2, differences in the axial velocities between the two methods were seen in the near wake, far wake, and at the turbine edges. When comparing to the experimental data, as in fig. 3, it was observed that the structured grid simulation performs better in the near wake, while the FM simulation is better in the far wake.
In sec. 3, radial velocities were compared with differences seen immediately upstream and downstream of the turbine (see fig. 7). Notably, the maximum relative errors between the two simulations were much larger for the radial velocities than then axial velocities, 0.2425 and 0.08593 respectively.
In sec. 4 turbulence intensity (TI) values are compared between the two simulation types and the experimental data. The distribution of TI in the turbine wake clearly differs between the FM and structured simulations, with increased TI seen at much greater radial distances from the turbine centerline in the FM simulations (see figs. 8-10). Compared to the experimental data both simulation types are similar to the 15% TI experimental data in the near wake although they fail to capture the amount of mixing in the far wake. The large increases in normalized TI of the 3% TI experiment are not recreated. Failure to precisely match the TI values of the experiments in the simulations may account for some of the differences seen.
These discrepancies may account for some of the differences seen in the axial flows, although the underlying mechanisms are not yet known. Other factors may also be contributing, including interpretation of the simulation parameters or selection of the time step for the structured grid simulations.
References
Mycek, Paul, Benoît Gaurier, Grégory Germain, Grégory Pinon, and Elie Rivoalen. 2014. “Experimental Study of the Turbulence Intensity Effects on Marine Current Turbines Behaviour. Part I: One Single Turbine.” Renewable Energy 66: 729–46. https://doi.org/10.1016/j.renene.2013.12.036.